
Model evaluation error metrics
Confusion matrix
NxN matrix, where N is the number of classes for classification.
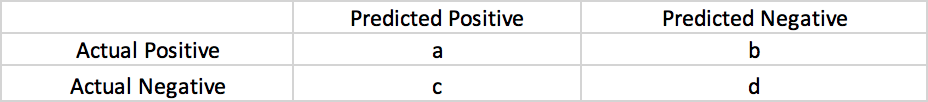
- Accuracy: ratio of correct prediction vs total predictions
- Positive Predictive Value or Precision: ratio of correctly predicted positive case to total positive predictions
- Negative Predictive Value: ratio of correctly predicted negative case to total negative predictions
- Sensitivity or Recall (True Positive rate): ratio of correctly positive prediction to actual number of positives
- Specificity (false positive rate): ratio of correctly negative prediction to actual number of negatives

ROC AUC
The ROC curve is the plot between sensitivity and (1- specificity)
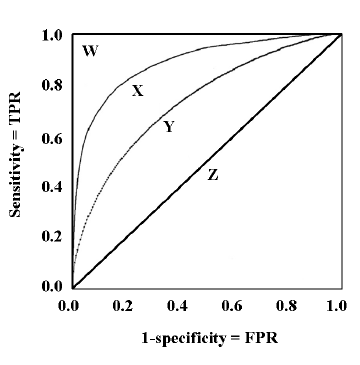 Here different lines are for different model. Model W is better than X, model X is better than Y and so on.
Written on August 24, 2018